
Patient No-Show Rate by Specialty
Signal Hill Strategies pulled appointment no-show rates from 28 peer-reviewed US studies published between 2012 and 2025, covering more than 4.1 million scheduled visits across 18 specialties and care settings. As of Q4 2026, the figures show that a patient's specialty, insurance, and booking lead time each shift how often visits go unattended.
Key Findings
|
Every empty exam room has a backstory. A patient books a follow-up two months out, the date slips off the calendar, and the slot sits unused while someone else waits for an opening. The figure most often repeated about these misses is a 23% average from a 2018 review of 105 studies published between 1981 and 2016. That average blends clinics on six continents and several decades of scheduling habits, so it says little about a US dermatology office or a Midwest neurology clinic today.
Our analysts read each US study and recorded its reported no-show rate, the number of scheduled visits, the study period, and any rates the authors broke out by insurance, lead time, or visit format. We grouped the studies by specialty and took the median of study rates wherever a specialty had more than one.
In the following sections, we compare no-show rates by specialty, by insurance type, by how far ahead the visit was booked, and by in-person versus telehealth format.
Patient No-Show Rates by Specialty in US Studies
Specialty is usually the first comparison a practice manager reaches for, since an imaging center and a cardiology clinic book very different kinds of visits. Each row below gathers the published studies for one specialty or care setting.
Median Reported No-Show Rate in Published US Studies, by Specialty (2012 to 2025)
Specialty | Studies | Median rate | Lowest study | Highest study |
Vascular surgery | 1 | 30.0% | One study | One study |
Community health centers | 2 | 29.1% | 16.5% | 41.6% |
GI endoscopy | 1 | 27.0% | One study | One study |
Pediatrics | 1 | 20.4% | One study | One study |
Otolaryngology (ENT) | 2 | 19.2% | 18.4% | 20.0% |
Cardiology | 2 | 16.5% | 4.6% | 28.4% |
Psychiatry and behavioral health | 2 | 16.3% | 15.9% | 16.8% |
Neurology | 1 | 16.0% | One study | One study |
Endocrinology and diabetes | 1 | 15.0% | One study | One study |
Plastic surgery | 1 | 13.8% | One study | One study |
Ophthalmology | 2 | 13.8% | 11.2% | 16.4% |
Dermatology | 1 | 13.4% | One study | One study |
Urology | 1 | 9.0% | One study | One study |
Radiation oncology | 1 | 9.0% | One study | One study |
Primary care | 3 | 7.8% | 7.4% | 16.2% |
Radiology and imaging | 2 | 7.7% | 3.25% | 12.1% |
Urogynecology (OB/GYN) | 1 | 6.7% | One study | One study |
Orthopaedics | 2 | 6.2% | 5.7% | 6.6% |
Source: Signal Hill Strategies analysis of 28 peer-reviewed US studies of outpatient appointment no-show rates, conducted November 3, 2026

Source: Signal Hill Strategies analysis of 28 peer-reviewed US studies of outpatient appointment no-show rates, conducted November 3, 2026
Key Findings
The three highest rates came from safety-net and VA settings. Vascular surgery new consults at a Houston VA clinic ran 30%, GI endoscopy with anesthesia at a San Francisco county hospital ran 27%, and the two community health center studies had a 29.1% median.
Radiology and imaging had one of the lowest medians, 7.7%. The University of Washington imaging study alone covered about 2.9 million outpatient exams from 2000 to 2015 at a 3.25% rate.
Rates inside one specialty can differ more than rates across specialties. Cardiology ran 4.6% at an Oregon adult congenital heart clinic and 28.4% at a Kansas City safety-net clinic, so a fair benchmark matches on setting and payer mix as well as specialty. Studies covering 2023 and later will show whether these gaps hold.
No-Show Rates for Medicaid vs Medicare vs Commercial Insurance
Insurance type is one of the most common breakdowns in no-show research. The table lists each study in the set that reported a separate rate for each payer group.
No-Show Rate by Insurance Type in Published US Studies (2012 to 2025)
Study, specialty, and state | Medicaid | Medicare | Commercial | Self-pay |
Sawalha 2025, cardiology, MO (2019 data) | 32.4% | 24.5% | 17.5% (Blue Cross) | 34.0% |
Fiorillo 2018, otolaryngology, KY | 28% | 15.3% | 12.9% | 7.3% |
Elkhider 2022, neurology, AR | 24% | 12% | – | – |
Nuti 2012, primary care, IN | 21.7% | 13.3% | 12.7% | 28.7% |
Shour 2023, Marshfield Clinic, WI and MI | 13.6% | 5.1% | 7.9% | – |
Chaudhry 2019, pediatric dermatology | 37% | – | 18% | – |
Sources: Sawalha et al. 2025; Fiorillo et al. 2018; Elkhider et al. 2022; Nuti et al. 2012; Shour et al. 2023; Chaudhry et al. 2019

Sources: Chaudhry et al. 2019; Fiorillo et al. 2018; Sawalha et al. 2025; Nuti et al. 2012; Shour et al. 2023
Key Findings
Medicaid patients had a higher no-show rate than commercially insured patients in all five studies that reported both. The gap ran from 5.7 percentage points across the Marshfield Clinic system to 19 points in a pediatric dermatology clinic.
Medicare patients missed fewer visits than Medicaid patients in all five studies that reported both groups. Their rates sat close to commercial rates in Indiana primary care (13.3% vs 12.7%) and Kentucky otolaryngology (15.3% vs 12.9%).
The pattern has exceptions. At UC Irvine's radiation oncology clinic, patients with public and private coverage both missed 9% of new consults from 2018 to 2022, and self-pay patients had the lowest rate of any group at the Kentucky ENT clinic. Practices with a large Medicaid share can use these gaps when setting reminder and overbooking rules.
How Appointment Lead Time Changes the No-Show Rate
Lead time is the stretch between the day a visit is booked and the day it happens. The studies below each reported rates for at least two booking windows, listed from the shortest window to the longest.
No-Show Rate at the Shortest and Longest Lead Times Studied (2015 to 2023)
Study, setting, and state | Shortest lead time | Rate | Longest lead time | Rate |
Elkhider 2022, neurology, AR | Under 7 days | 8% | 60 days or more | 19% |
Shour 2023, Marshfield Clinic, WI and MI | Under 1 day | 2.3% | Over 4 weeks | 9.3% |
Rosenbaum 2018, outpatient imaging, WA | 1 week | 2.71% | 6 months | 9.46% |
McMullen 2015, ophthalmology resident clinic, VA | 0 to 2 weeks | 9.1% | 6 months | 38.3% |
McMullen 2015, ophthalmology faculty clinic, VA | 0 to 2 weeks | 2.4% | 6 months | 6.9% |
Chaudhry 2019, pediatric dermatology, Medicaid | 2 weeks | 11% | 4 weeks | 19% |
Chaudhry 2019, pediatric dermatology, private insurance | 2 weeks | 4% | 4 weeks | 7% |
Sources: Elkhider et al. 2022; Shour et al. 2023; Rosenbaum et al. 2018, via AuntMinnie; McMullen and Netland 2015; Chaudhry et al. 2019

Key Findings
Every study in the table found a higher no-show rate at its longest lead time than at its shortest. The increase ranged from about 1.7 times in pediatric dermatology to about 4.2 times in the University of Virginia ophthalmology resident clinic.
Long waits hit some clinics far harder than others. Visits booked six months out at the University of Virginia resident eye clinic went unattended 38.3% of the time, compared with 6.9% at the faculty clinic in the same department.
Visits booked more than a month ahead are the group these studies flag most consistently. Shorter booking windows and an added reminder for far-off visits target the slots most likely to go empty, and newer studies will show whether same-week booking keeps its edge.
Telehealth vs In-Person No-Show Rates
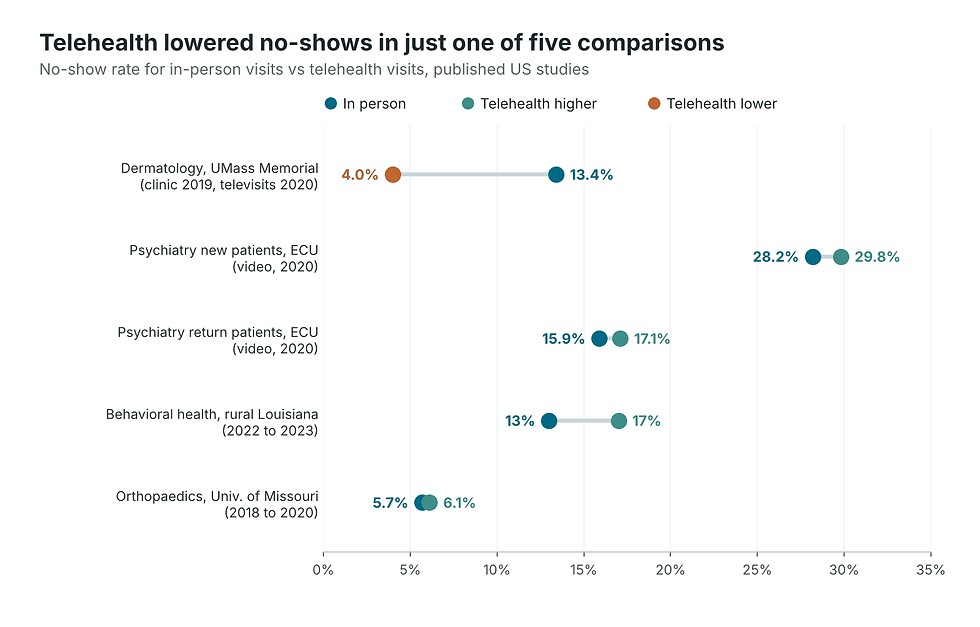
Video and phone visits spread quickly in 2020. Several US clinics then compared no-show rates for the two formats directly, and the results do not all point the same way.
No-Show Rate for In-Person and Telehealth Visits in Published US Studies (2018 to 2023)
Study, specialty, and state | Period | In person | Telehealth | Phone only |
Franciosi 2021, dermatology, MA | 2019 clinic, 2020 televisits | 13.4% | 4.0% | – |
Muppavarapu 2022, psychiatry new patients, NC | Mar to Dec 2020 | 28.2% | 29.8% (video) | 7.7% |
Muppavarapu 2022, psychiatry return patients, NC | Mar to Dec 2020 | 15.9% | 17.1% (video) | 7.8% |
Bhatta 2023, behavioral health, LA | May 2022 to Jan 2023 | 13% | 17% | – |
Spence 2024, orthopaedics, MO | Jul 2018 to Jun 2020 | 5.7% | 6.1% | – |
Key Findings
Only the UMass dermatology comparison showed a large drop with telehealth, and it set 2019 clinic visits against 2020 televisits. In the three studies that compared formats over the same months, telehealth rates matched or exceeded in-person rates.
Phone visits were the exception at East Carolina University's psychiatry clinic. Return patients missed 7.8% of phone visits from March to December 2020, about half the in-person rate for the same group.
Switching a visit to video has not reliably cut missed appointments in these studies. Same-period comparisons from 2024 onward will add more evidence on which formats hold attendance.
For patients, a missed appointment often means a longer wait for the next opening. For practices, it means an empty slot that someone on the waitlist could have used. The studies here show that the risk is uneven, with higher rates in safety-net settings, among Medicaid patients, and for visits booked far in advance.
The same few factors keep surfacing across the research. The 2018 review of 105 studies found lead time significant in 41 of the 49 studies that tested it, and insurance or form of payment significant in 24 of 39. The US studies published since then point the same way, with telehealth adding a new format to measure without yet changing the overall picture.
So if you run a US outpatient practice and your no-show rate lands between 6% and 21%, you sit within the range where 15 of the 18 specialty medians in these studies fall.
Sources
Signal Hill Strategies analysis of 28 peer-reviewed US studies of outpatient appointment no-show rates, conducted November 3, 2026
Elkhider H et al. Predictors of No-Show in Neurology Clinics. Healthcare, 2022
White R et al. Failure to Attend Urology Appointments: What Are We Missing. AUANews, 2021
Melnyk AI et al. No-Show Rates in a Urogynecology Clinic. Urogynecology, 2024
Methodology
Signal Hill Strategies analysts gathered peer-reviewed US studies that reported an outpatient appointment no-show rate, using publisher pages, PubMed records, and journal sites read on November 3, 2026.
Each study's rate is the overall no-show rate its authors reported. For the Muppavarapu and Bhatta studies, the overall rate was calculated from the reported no-show and visit counts. For McMullen and Netland, it was calculated from the resident and faculty clinic rates weighted by each clinic's appointment count.
For Spence et al., the in-clinic rate is used. For Ojinnaka et al., the general pediatrics rate is used, and for Shour et al., the primary care rate is used in the specialty table.
Specialty medians are the median of study rates within each specialty. Where a specialty had two studies, the median is the midpoint of the two.
Most studies define a no-show as a scheduled visit the patient missed without canceling. Several report cancellations separately, and those cancellations are excluded here.
Some studies cover a single visit type: vascular surgery and radiation oncology new consults, GI endoscopy with anesthesia, ophthalmology new patients (Chiam et al.), and screening mammography.
Rosenbaum et al. and Wang et al. figures are as reported in trade coverage of the Journal of the American College of Radiology papers.
The visit total sums the scheduled visits or patients reported by each study that gave a count.
Derived figures, including medians, ratios, and percentage-point gaps, were calculated from these data.


Comments